Bitcoin's $79,200: A Pivotal Resistance Threshold
In the volatile world of cryptocurrency, Bitcoin has once again reached a defining moment as it hovers near the $79,200 level, a threshold that analysts are watching closely for signs of either a major breakout or a potential reversal. This pivotal range, spanning from $78.2K to $79.2K, is shaped by key on-chain indicators that reflect investor behavior and market sentiment. As of April 2026, these metrics suggest that Bitcoin's price action could either propel it to new heights or cap its growth, influencing broader crypto trends.
Understanding the On-Chain Resistance Levels
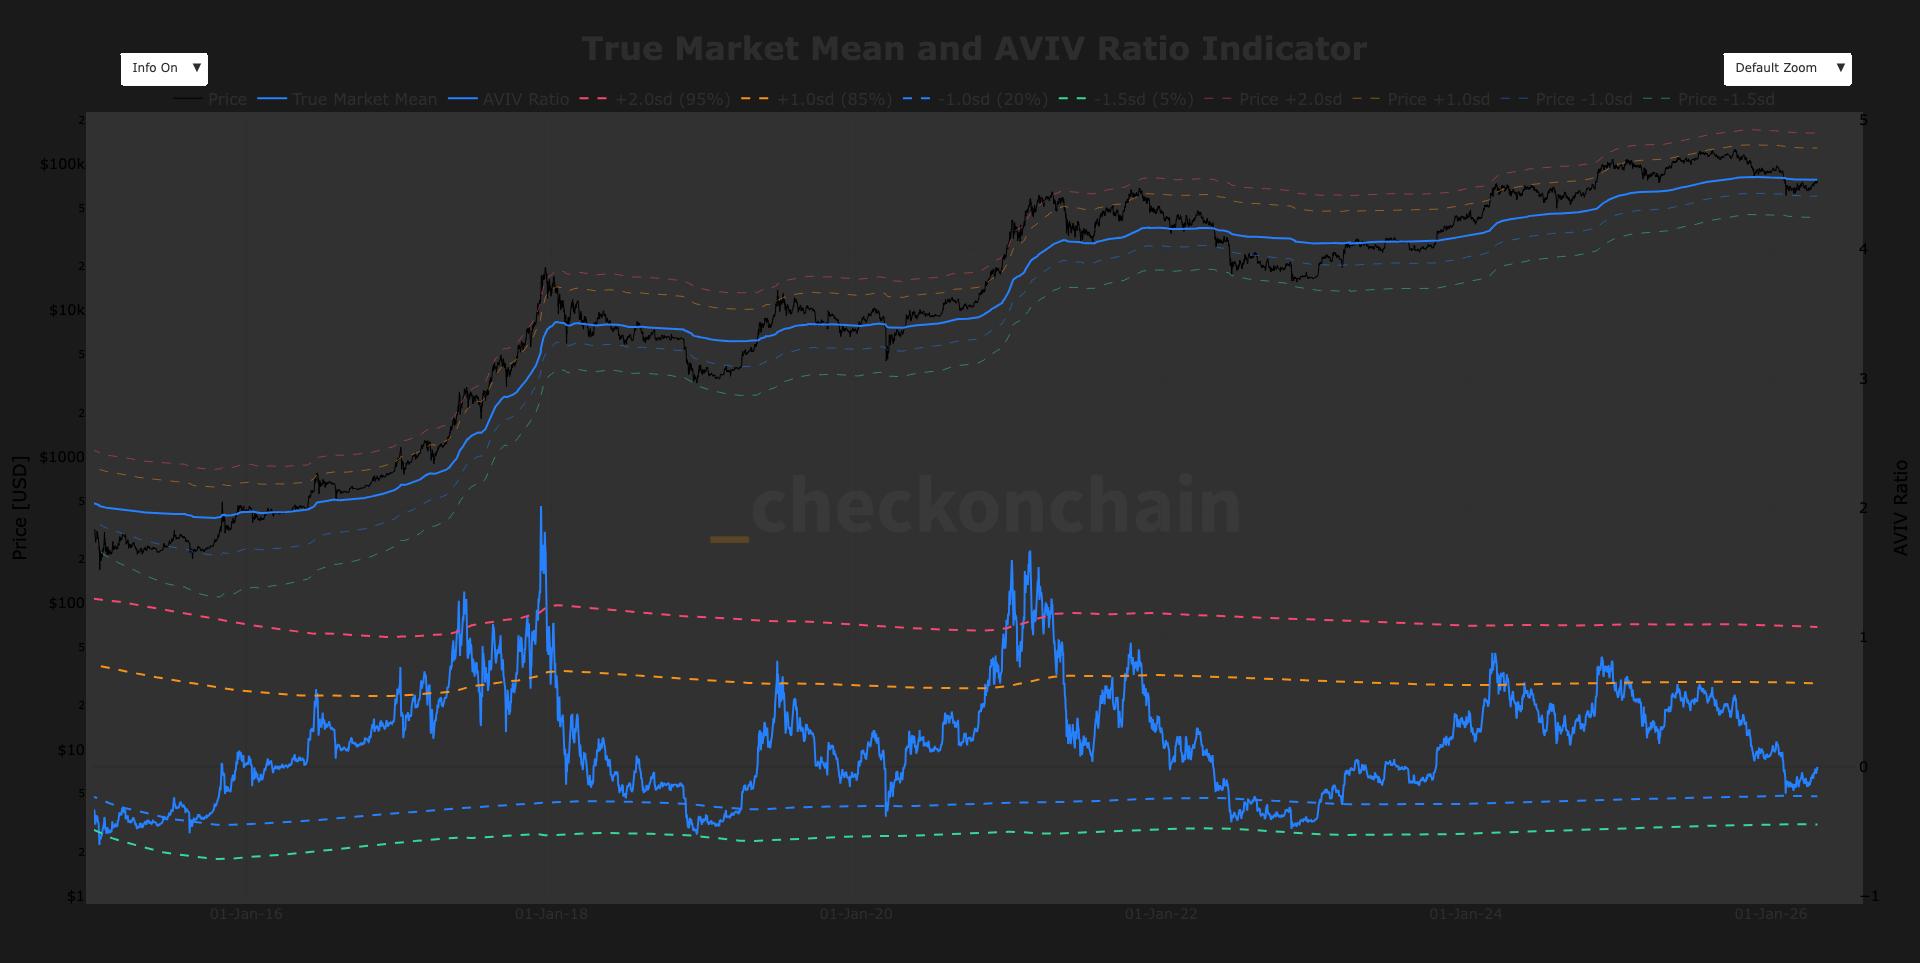
On-chain analysis has become an essential tool for deciphering Bitcoin's price dynamics, and the current scenario highlights two primary metrics: the True Market Mean and the Short-Term Holder cost basis. The True Market Mean represents an average price point derived from the realized value of all Bitcoin in circulation, adjusted for various market factors. In this case, it aligns closely with the $78.2K mark, indicating a level where a significant portion of holders might start selling if prices dip below it. Meanwhile, the Short-Term Holder cost basis, which tracks the average purchase price of coins held for less than 155 days, converges around $79.2K. This creates a tight resistance band that could act as a psychological and technical barrier.
Experts point out that when these indicators overlap, as they do now, it often signals a make-or-break point. If Bitcoin sustains above $79.2K, it could trigger a wave of buying from short-term investors looking to capitalize on momentum. Conversely, failure to breach this level might lead to increased selling pressure, as holders realize profits or cut losses. This analysis is based on historical patterns, such as the 2024 bull run, where similar resistance zones either propelled prices upward or resulted in corrections.
Implications for the Market
The potential outcomes of this resistance test carry wide-reaching implications for the cryptocurrency market. A successful breakout above $79.2K could ignite a rally, drawing in institutional investors and retail traders alike, potentially pushing Bitcoin toward $100,000 or beyond in the coming months. This scenario would bolster confidence in digital assets as a whole, encouraging more adoption in traditional finance sectors like ETFs and derivatives. On the flip side, if Bitcoin falls back within the $78.2K to $79.2K range, it might exacerbate volatility, leading to a broader market downturn. Traders could see heightened liquidations, with altcoins often following Bitcoin's lead and experiencing similar price swings.
From an investor perspective, this moment underscores the importance of risk management. Those holding positions might consider strategies like dollar-cost averaging or setting stop-loss orders to navigate the uncertainty. Regulatory developments in 2026, such as ongoing discussions around global crypto standards, could further amplify these effects, as clearer frameworks might either support or hinder price recovery.
Context Within Bitcoin's Price History
Bitcoin's journey to this critical juncture is rooted in its storied history of booms and busts. Since its inception in 2009, the asset has undergone several cycles, with notable resistance levels playing a decisive role. For instance, in 2021, Bitcoin faced resistance around $64,000 before surging to all-time highs, only to retrace amid macroeconomic pressures. Fast-forward to 2026, the current landscape is shaped by factors like increased institutional adoption, advancements in blockchain technology, and evolving monetary policies from central banks. The integration of Bitcoin into corporate treasuries and the rise of decentralized finance (DeFi) protocols have added layers of complexity, making on-chain data more influential than ever.
Analysts from platforms like CoinDesk emphasize that on-chain metrics are not infallible but provide a data-driven lens for prediction. The $78.2K to $79.2K range, in particular, represents a convergence of supply and demand dynamics, where the volume of Bitcoin held at these prices could tip the scales. As the market enters this high-stakes period, observers are monitoring trading volumes, hash rates, and whale movements for additional clues.
- Key on-chain indicators to watch: True Market Mean for long-term trends and Short-Term Holder basis for immediate sentiment.
- Potential catalysts: Upcoming halving events or economic data releases could influence the outcome.
- Broader impact: A breakout might accelerate innovation in blockchain applications, while a reversal could delay mainstream adoption.
In conclusion, the $79,200 level stands as a testament to Bitcoin's enduring appeal and the intricate interplay of market forces. As investors brace for what could be a defining chapter in 2026, the resolution of this resistance will likely shape not only Bitcoin's trajectory but also the future of the entire crypto ecosystem. Staying informed and adaptable will be crucial for navigating these waters.
This article is based on factual reporting from:
www.coindesk.com — Original Report ↗